
This media is not supported in your browser
VIEW IN TELEGRAM
🚨 Social Distancing Works
and this is the best #SocialDistancing video I've seen.
#COVID19
Stay Safe.
🦅 @PerspectiveIX via Ohio Dept of Health.
and this is the best #SocialDistancing video I've seen.
#COVID19
Stay Safe.
🦅 @PerspectiveIX via Ohio Dept of Health.
👶 Kids’ Daily Screen Time During Coronavirus
Parents were already struggling to limit screen time for kids when they were in school, let alone trying to pull them away from their devices while they are forced to stay home away from their friends, peers and regular activities.
#COVID19
🦅 @PerspectiveIX via Axios.
Parents were already struggling to limit screen time for kids when they were in school, let alone trying to pull them away from their devices while they are forced to stay home away from their friends, peers and regular activities.
#COVID19
🦅 @PerspectiveIX via Axios.
📱 Our Digital Behaviours are Changing
Due to #COVID19 lockdowns:
- TV Streaming Services: 57%
- Social Media: 47%
- Messenger Services: 46%
🦅 @perspectiveix via WeAreSocial.
Due to #COVID19 lockdowns:
- TV Streaming Services: 57%
- Social Media: 47%
- Messenger Services: 46%
🦅 @perspectiveix via WeAreSocial.
📊 iPad App Downloads See First Positive Quarterly Growth in Four Years
Driven by a surge in use and adoption of the device during the #COVID19 pandemic, quarterly first-time downloads of apps for #Apple’s #iPad surpassed 1.1 billion worldwide in Q1 2020, marking the first year-over-year growth in this metric since the Q4 2013 and a 40% increase from Q1 2019.
At the same time, quarterly global consumer spending in iPad apps saw its largest YoY increase since Q4 2014 at 16%, while crossing the $2 billion threshold for the first quarter ever.
🦅 @perspectiveix via SensorTower.
📊 Biggest Gainers and Losers Among Online Service Categories During COVID19
Comparing January & March 2020 data to see which market categories saw increases or decreases in visitation and users (which is defined as “user reach” in the chart) as the #COVID19 pandemic developed, for each market category in the US, Verto calculated the percentage of growth in user reach (i.e. how many consumers out of the total online user base have used a service in its respective category during the month).
They then averaged these growth rates across all services in a given category and compared all the categories. The chart below illustrates the findings.
Biggest Increases
- News sites/apps have seen the most significant increase (55% more users on average).
- Law/government sources (which have showcased official information, instructions, and guidelines related to public health) have also spiked, gaining almost 40% more users.
- The health/fitness and education markets have also seen significant rises (21% and 19% respectively) in user reach. Remote work tools (including the productivity category) and the overall use of social media and messaging apps (including video conferencing) have also gained almost 10% more users, which is notable given that these markets have massive user bases even during normal times.
Biggest Decreases
- Gambling related sites/apps have seen the biggest decrease in user activity. (With professional sports suspended, there’s nothing for consumers to gamble on.)
- Sports apps/sites are also down, showing 14% fewer users.
Read more on Verto.
🦅 @perspectiveix
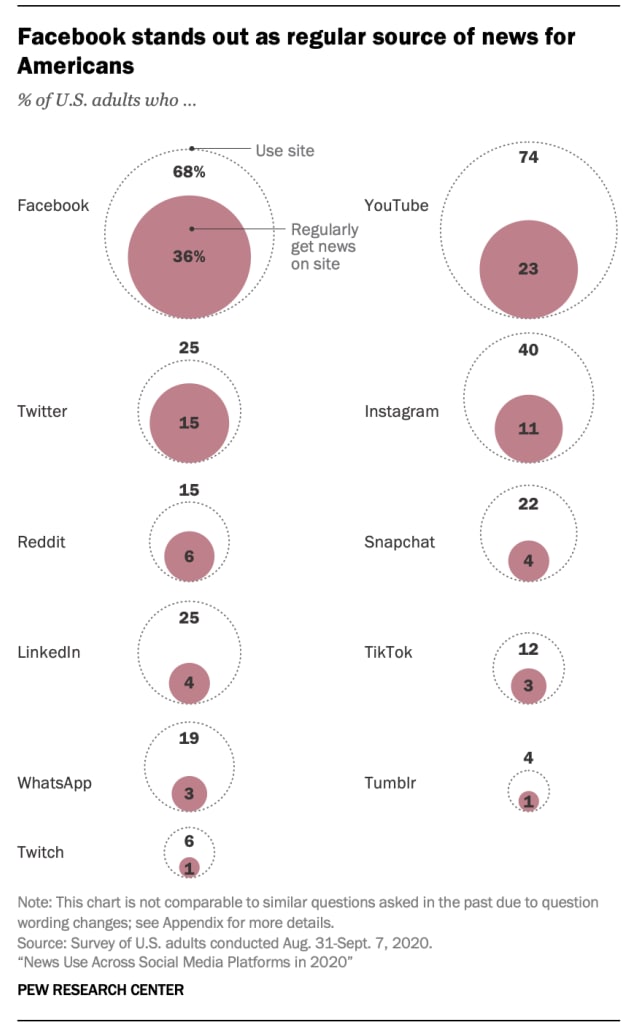
🗞 News Use Across Social Media Platforms in 2020
As #SocialMedia companies struggle to deal with misleading information on their platforms about the #USElection, the #COVID19 pandemic and more, a large portion of Americans continue to rely on these sites for news. About half of US adults (53%) say they get news from social media “often” or “sometimes,” and this use is spread out across a number of different sites, according to a Pew Research Center survey.
Among 11 social media sites asked about as a regular source of news, #Facebook sits at the top, with about a third (36%) of Americans getting news there regularly. #YouTube comes next, with 23% of US adults regularly getting news there. #Twitter serves as a regular news source for 15% of US adults.
Other social media sites are less likely to be regular news sources. About one-in-ten Americans or fewer report regularly getting news on #Instagram (11%), #Reddit (6%), #Snapchat (4%), #LinkedIn (4%), #TikTok (3%), #WhatsApp (3%), #Tumblr (1%) and #Twitch (1%).
These lower percentages for news use are in some cases related to the fact that fewer Americans report using them at all, compared with the shares who use Facebook and YouTube.
Read more on Pew Research Center.
🦅 @perspectiveix