
📈 Microsoft's Share Price Tripled Under Satya Nadella
Five years ago, Satya Nadella took over as CEO at #Microsoft, following in the footsteps of Bill Gates and Steve Ballmer. It wasn’t an easy situation to come in for Nadella, considering that Microsoft had missed the transition to mobile devices, Windows 8 had flopped miserably and the PC market had started its decline, putting Microsoft’s core business, Windows, into question.
Back in 2014, most people given the choice to invest $1,000 in either Microsoft or #Apple, probably would have invested in the latter, considering the huge success that Microsoft’s old foe was having with its mobile devices, most importantly the iPhone. And yet, here we are, five years into Nadella’s tenure and Microsoft is not only the most valuable public company on the planet, it has also outperformed Apple over the past five years.
🚀 @PerspectiveIX via Statista.
📰 The most engaged publishers on Facebook in January 2019
It’s time once again for our monthly rankings of the top publishers on Facebook, and it’s certainly been a busy news month.
This has been reflected in the engagements driven by the top publishers on Facebook, with abnormally high numbers in the first month of 2019 compared with previous months we have looked at.
Some top-line insights first:
- Overall engagements were well up on the previous month, as much as 50% higher for some publishers
- CNN leaped back up the rankings, jumping to almost 40 million engagements for the month
- The Daily Mail also jumped in engagements, from 27 million to nearly 40 million
🚀 @PerspectiveIX via Newswhip.
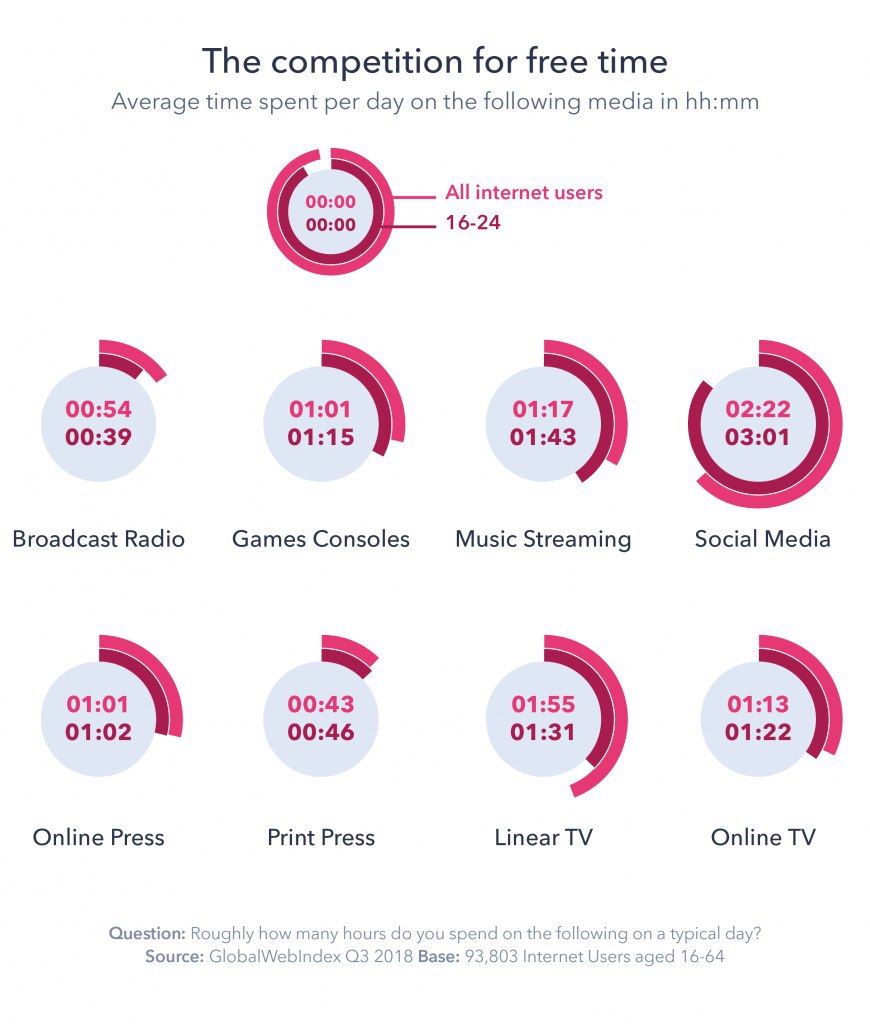
📺 Competing for Consumer Attention
The pressure on linear TV isn’t just coming from streaming services such as #Netflix and #Hulu. Both are part of a wider competition for the consumer’s free time with other media formats.
Consumers are now clocking up an average of around 2:20 hours per day on #SocialMedia, rising to around 3 hours among 16-24s. Online and print press, games consoles, music streaming and broadcast radio collectively constitute around 5 hours of a consumer’s day. That’s not including the hour and a quarter spent watching online #TV, and the 6 ¾ hours spent online more broadly on a daily basis.
Consumer attention in this crowded environment has become harder to maintain.
Linear TV, does however, have a lot to boast about here. With the exception of social media, linear TV captures the largest share of daily media time among consumers, standing at 18%, significantly above online TV’s 12%. And considering social media engagement happens frequently throughout the day whereas TV engagement is mostly in long durations, that’s an impressive feat.
🚀 @PerspectiveIX via GlobalWebIndex.
📸 Happy Saturday, Instagrammers!
'The Dark Side Of The Internet' by u/BUTTRESS_OF_WINDSOR.
🚀 @PerspectiveIX
'The Dark Side Of The Internet' by u/BUTTRESS_OF_WINDSOR.
🚀 @PerspectiveIX
📊 Top App Publishers Worldwide for Q4 2018 by Downloads
The top mobile app publisher worldwide by downloads for Q4 2018 was #Facebook with more than 800 million new installs during the quarter.
Read more on SensorTower.
🚀 @PerspectiveIX
The top mobile app publisher worldwide by downloads for Q4 2018 was #Facebook with more than 800 million new installs during the quarter.
Read more on SensorTower.
🚀 @PerspectiveIX
🐦 Brand Tweet Length Distribution
On avg, only 12% of tweets are longer than 140 characters, with 1% hitting the 280-character limit. (Twitter's data, 2018)
Brands are less brief: 39% of brand tweets are longer than 140 characters, with 6.6% of tweets containing 245-280 characters. (Socialbakers data, 2018)
🚀 @PerspectiveIX via Socialbakers.
💰 Amazon Challenges Ad Duopoly
According to a new eMarketer report, digital ad spending in the United States will exceed traditional media spending, e.g. TV, print and radio ads, for the first this year. Boosted by the ongoing mobile #advertising boom, digital ad spending is expected to grow 19 percent to $129 billion in 2019.
While the digital ad market is still dominated by #Google and #Facebook, who account for roughly 60 percent of total spending, a third company is challenging the de-facto duopoly of the world’s largest search and social media companies. Online retail behemoth #Amazon has quietly built a billion-dollar ad business which is growing at a rate of 50 percent per year.
🚀 @PerspectiveIX via Statista.
This media is not supported in your browser
VIEW IN TELEGRAM
🤯 Top 15 BEST global brands ranking for the last 19 years...
Watch big name tech companies take-over at the end!
Keep an eye on #Apple, #Google, and #Nokia...
Interbrand via Matt Navarra.
🚀 @PerspectiveIX
Watch big name tech companies take-over at the end!
Keep an eye on #Apple, #Google, and #Nokia...
Interbrand via Matt Navarra.
🚀 @PerspectiveIX
📈 Instagram Stories & Ad Spend
#Instagram now accounts for almost 1 in 5 (18% of) marketing dollars spent on #Facebook’s properties, doubled in just a year, from 9.1% in Q4 2017.
A significant driver behind Instagram’s continued growth is the Stories format. Marin reports that for its clients, Stories accounted for about one-third (34%) of the ad spend on Instagram in Q4 2018 – a more than 10-fold increase in share when compared to the year-earlier period.
Read more on MarketingCharts.
🚀 @PerspectiveIX
📱 Top App Categories Worldwide for Q4 2018 by Downloads - App Store
The top #AppStore category worldwide by downloads in Q4 2018 was Games with 2.09 billion installs for the quarter. Despite passing the two billion mark, the category saw downloads decrease 1.3 percent year-over-year from 2.11 billion in 4Q17.
#iOS
Read more on SensorTower.
🚀 @PerspectiveIX
The top #AppStore category worldwide by downloads in Q4 2018 was Games with 2.09 billion installs for the quarter. Despite passing the two billion mark, the category saw downloads decrease 1.3 percent year-over-year from 2.11 billion in 4Q17.
#iOS
Read more on SensorTower.
🚀 @PerspectiveIX
📱 Top App Categories Worldwide for Q4 2018 by Downloads - Google Play
Games was also the top category worldwide on #Google Play in Q4 2018 with more than 7.25 billion installs, followed by Tools, Entertainment, Communication, and Social.
Games saw modest growth on #GooglePlay in Q4, with installs increasing 3 percent year-over-year. The Social category grew 53 percent year-over-year, surpassing Photography to take the No. 5 spot. This change was driven by enormous growth of social media apps in India, specifically #TikTok, along with two other ByteDance-owned apps, Helo and Vigo Video.
#Android
Read more on SensorTower.
🚀 @PerspectiveIX
📊 Gen Z is Still on Facebook
Think you cannot target #GenZ on #Facebook? Think again!
Socialbakers' data shows that this generation is giving brands as much love as #Millennials!
🚀 @PerspectiveIX via Socialbakers.
Think you cannot target #GenZ on #Facebook? Think again!
Socialbakers' data shows that this generation is giving brands as much love as #Millennials!
🚀 @PerspectiveIX via Socialbakers.
Is your phone on vibrate or ringer?
Anonymous Poll
40%
Always vibrate
42%
Sometimes vibrate, sometimes ringer
18%
Always ringer
🎵 Streaming Dominates Music Industry Revenue
The #music industry is generating the lion share of its revenue from streaming. A recent Recording Industry Association of America report found that three quarters of all revenue in the industry comes from streaming services like #Spotify. Last year RIAA reported that only 65 percent of revenue came from streaming, pointing to how prevalent and essential streaming has become to making money in music.
Overall revenue from streaming music grew by 30 percent year-over-year, hitting a total of $7.4 billion for 2018. While the growth seems to be ramping up, the industry is rebounding from a low. This year is the first time the industry is even nearing what its total revenue was over a decade ago. The major reasons for the slump in recent years has been the digitization of music circulated on the internet.
🚀 @PerspectiveIX via Statista.
❓ Do you stream music?