
This media is not supported in your browser
VIEW IN TELEGRAM
📺 Finally, a #TV display you can roll up and take with you - by #LG!
Join 🚀 @PerspectiveIX for more awesome stuff!
🌀 http://prs.pctvix.co/TelegramIX
Join 🚀 @PerspectiveIX for more awesome stuff!
🌀 http://prs.pctvix.co/TelegramIX
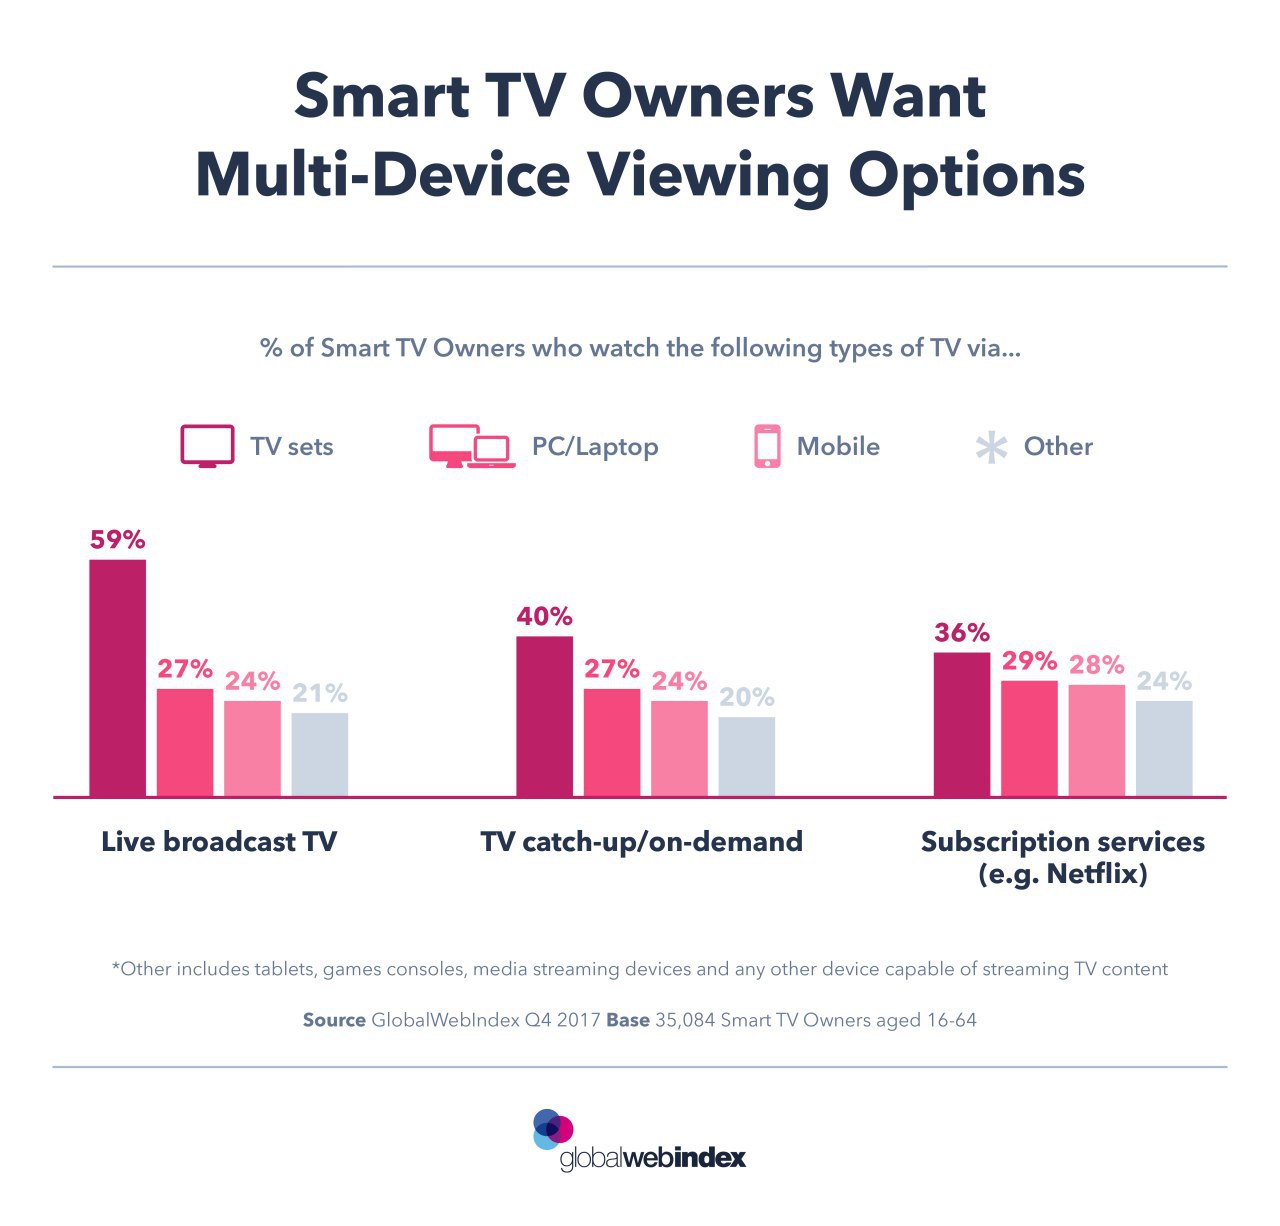
📺 Smart TV Owners Want Multi-Device Viewing Options
Smart TV Owners watch a combination of both broadcast and online #TV. Further exploring their diverse TV engagement habits shows they frequently ventures beyond their smart TVs, watching their favorite TV shows and films across a broad range of devices, demonstrating that it’s the content, not the device, that governs preferences.
🚀 @PerspectiveIX
🌀 http://prs.pctvix.co/TelegramIX
📱 vs 📺 Mobile Soon to Pass TV in Time Spent
But IoT could one day soon capture some of those mobile minutes
Americans are spending less time with most major media, with one major exception: #smartphones.
In 2018, adults will still dedicate more time per day to #TV—nearly 3 hours, 50 minutes—than to any other medium, but TV time is shrinking, down from 4 hours, 37 minutes in 2012. #Mobile time will increase to 3 hours, 35 minutes in 2018, and by 2019 mobile will be the new leader in time spent, with 3 hours, 43 minutes of engagement vs. TV’s 3 hours, 42 minutes.
🚀 @PerspectiveIX
☕️ prs.pctvix.co/2M8AAOb
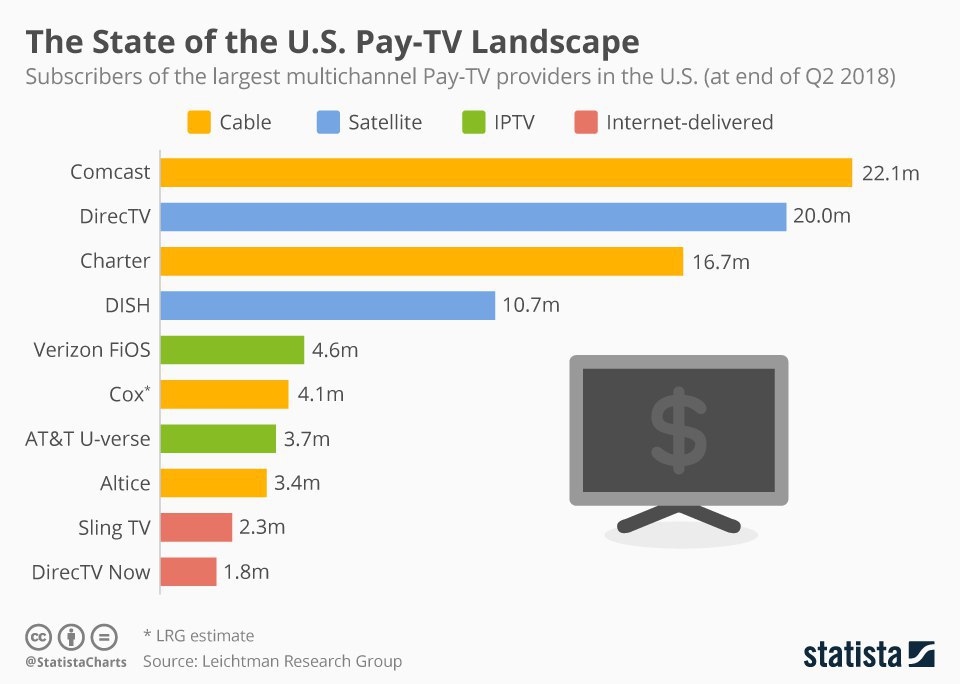
📺 The Largest Pay-TV providers in the US at the End of Q2 2018
According to data compiled by the Leichtman Research Group, the largest pay-TV providers (or subscription-based #TV services) in the US 🇺🇸, representing approximately 95% of all subscribers, had 91.3 million subscribers at the end of Q2 2018, down 400k since the end of the Q1. Meanwhile #Netflix, arguably the biggest threat to the entire industry, ended the Q2 with 57.4 million domestic subscribers.
🚀 @PerspectiveIX via Statista.
📺 Social Media & TV Ecosystem
In a connected world, #TV industry could've been left behind. But it has found social media as a unique opportunity to organically reach its own audience through various platforms.
To gain a better understanding about how #SocialMedia posts generated by TV-affiliated accounts are being created and consumed, Nielsen has looked at over 142,000 pieces of content during a three week period just ahead of the fall TV season. These pieces of TV-related content generated more than 154 million engagements, likes, comments, re-posts, etc., across #Twitter, #Facebook and #Instagram.
🚀 @PerspectiveIX via Nielsen.
❓ Which platform do you prefer?
🏆 TV at the Top
#TV continues to rank 1st as Americans' preferred platform for getting #news!
🚀 @PerspectiveIX via PewResearch.
❓ Which of the following would you say you prefer for getting news?
#TV continues to rank 1st as Americans' preferred platform for getting #news!
🚀 @PerspectiveIX via PewResearch.
❓ Which of the following would you say you prefer for getting news?
📺 The Social Side of TVideo Viewing
As internet-connected devices proliferate and streaming services grow in popularity, it’s easy to assume that TV viewing has become an individual pastime. But the reality is that just about half (48%) of #TV or video total viewing time in the 🇺🇸 is still done in groups – and this may even be growing as a social activity.
🚀 @PerspectiveIX - #Infographic from GfK via MarketingCharts.
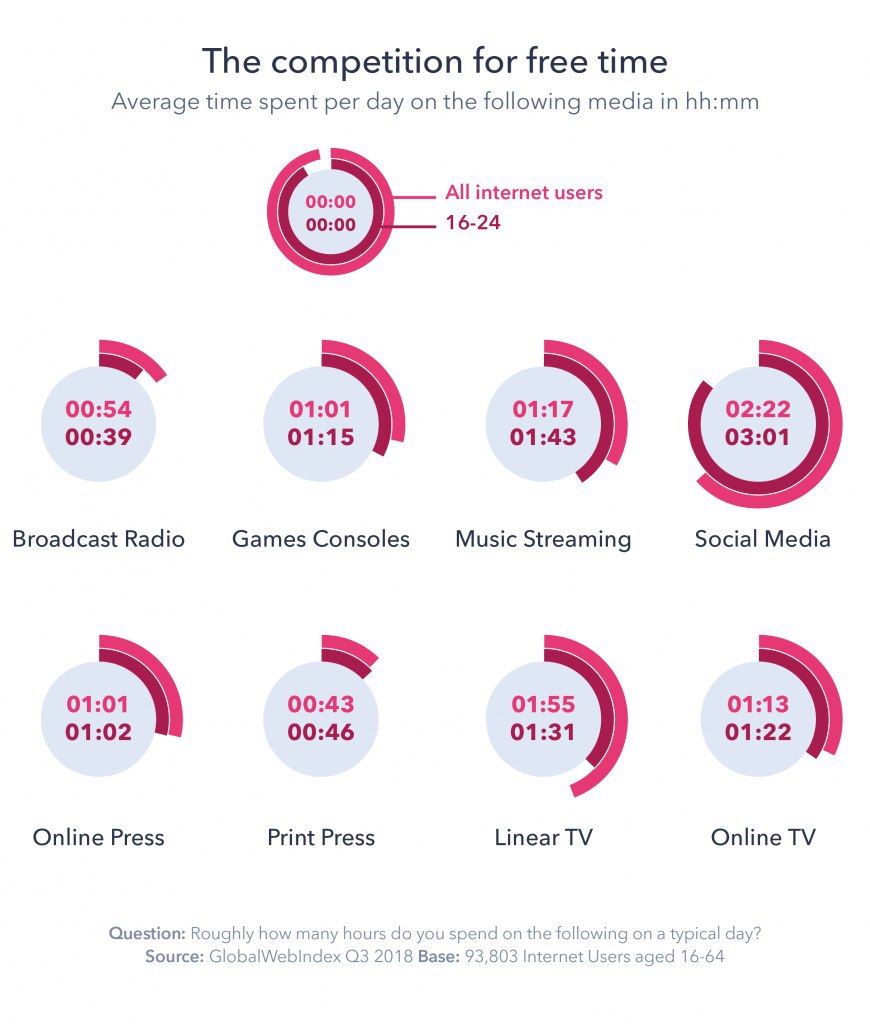
📺 Competing for Consumer Attention
The pressure on linear TV isn’t just coming from streaming services such as #Netflix and #Hulu. Both are part of a wider competition for the consumer’s free time with other media formats.
Consumers are now clocking up an average of around 2:20 hours per day on #SocialMedia, rising to around 3 hours among 16-24s. Online and print press, games consoles, music streaming and broadcast radio collectively constitute around 5 hours of a consumer’s day. That’s not including the hour and a quarter spent watching online #TV, and the 6 ¾ hours spent online more broadly on a daily basis.
Consumer attention in this crowded environment has become harder to maintain.
Linear TV, does however, have a lot to boast about here. With the exception of social media, linear TV captures the largest share of daily media time among consumers, standing at 18%, significantly above online TV’s 12%. And considering social media engagement happens frequently throughout the day whereas TV engagement is mostly in long durations, that’s an impressive feat.
🚀 @PerspectiveIX via GlobalWebIndex.
📱 the Evolution of Video
As the definition of #TV becomes increasingly fluid, #mobile has opened additional opportunities to provide viewers with high-quality content—where they want it, when they want it and how they want it. As of August 2018, mobile phones have become the dominant device for watching online video, surpassing computers and other internet-connected devices.
2019 is shaping up to be an inflection point for video. It is forecasted that mobile will surpass traditional TV entirely as the medium attracting the most entertainment minutes in the US.
🚀 @PerspectiveIX via Snap.
📰 News Consumption in the UK (2019)
Key findings:
- While TV remains the most-used platform for #news nowadays by UK adults, usage has decreased since last year (75% vs. 79% in 2018). At the same time, use of social media for news use has gone up (49% vs. 44%).
- Use of TV for news is much more likely among the 65+ age group (94%), while the #internet is the most-used platform for news consumption among 16-24s and those from a minority ethnic background.
- Fewer UK adults use BBC TV channels for news compared to last year, while more are using #SocialMedia platforms.
- When rated by their users on measures such as quality, accuracy, trustworthiness and impartiality, magazines continue to perform better than other news platforms, followed by #TV.
🦅 @PerspectiveIX via Ofcom.